User guide
This guide is for the people who run studies: CRAs, study coordinators, TMF specialists, and anyone else on a clinical operations team. It walks through the everyday tasks (uploading documents, approving and signing, running monitoring visits, logging deviations, reporting enrollment) as they look in the app, with no code. If you script against the API or query the database directly, the cookbook covers the same tasks in R, Python, and curl.
One idea explains most of what you’ll see: the app never asks you to update a status. You record what happened (a document was uploaded, a visit was conducted, an issue was resolved), and every status on every page is computed from those facts each time the page loads. Nothing needs to be remembered, refreshed, or reconciled, and a status can never be out of date.
The dashboard
The dashboard is the study at a glance. Everything on it is clickable, and every filter you apply lands in the page address, so a filtered view can be pasted straight into an email or a chat. Running more than one study? The dropdown in the header switches between them (the app remembers your choice), and the Portfolio page shows every study’s numbers side by side.
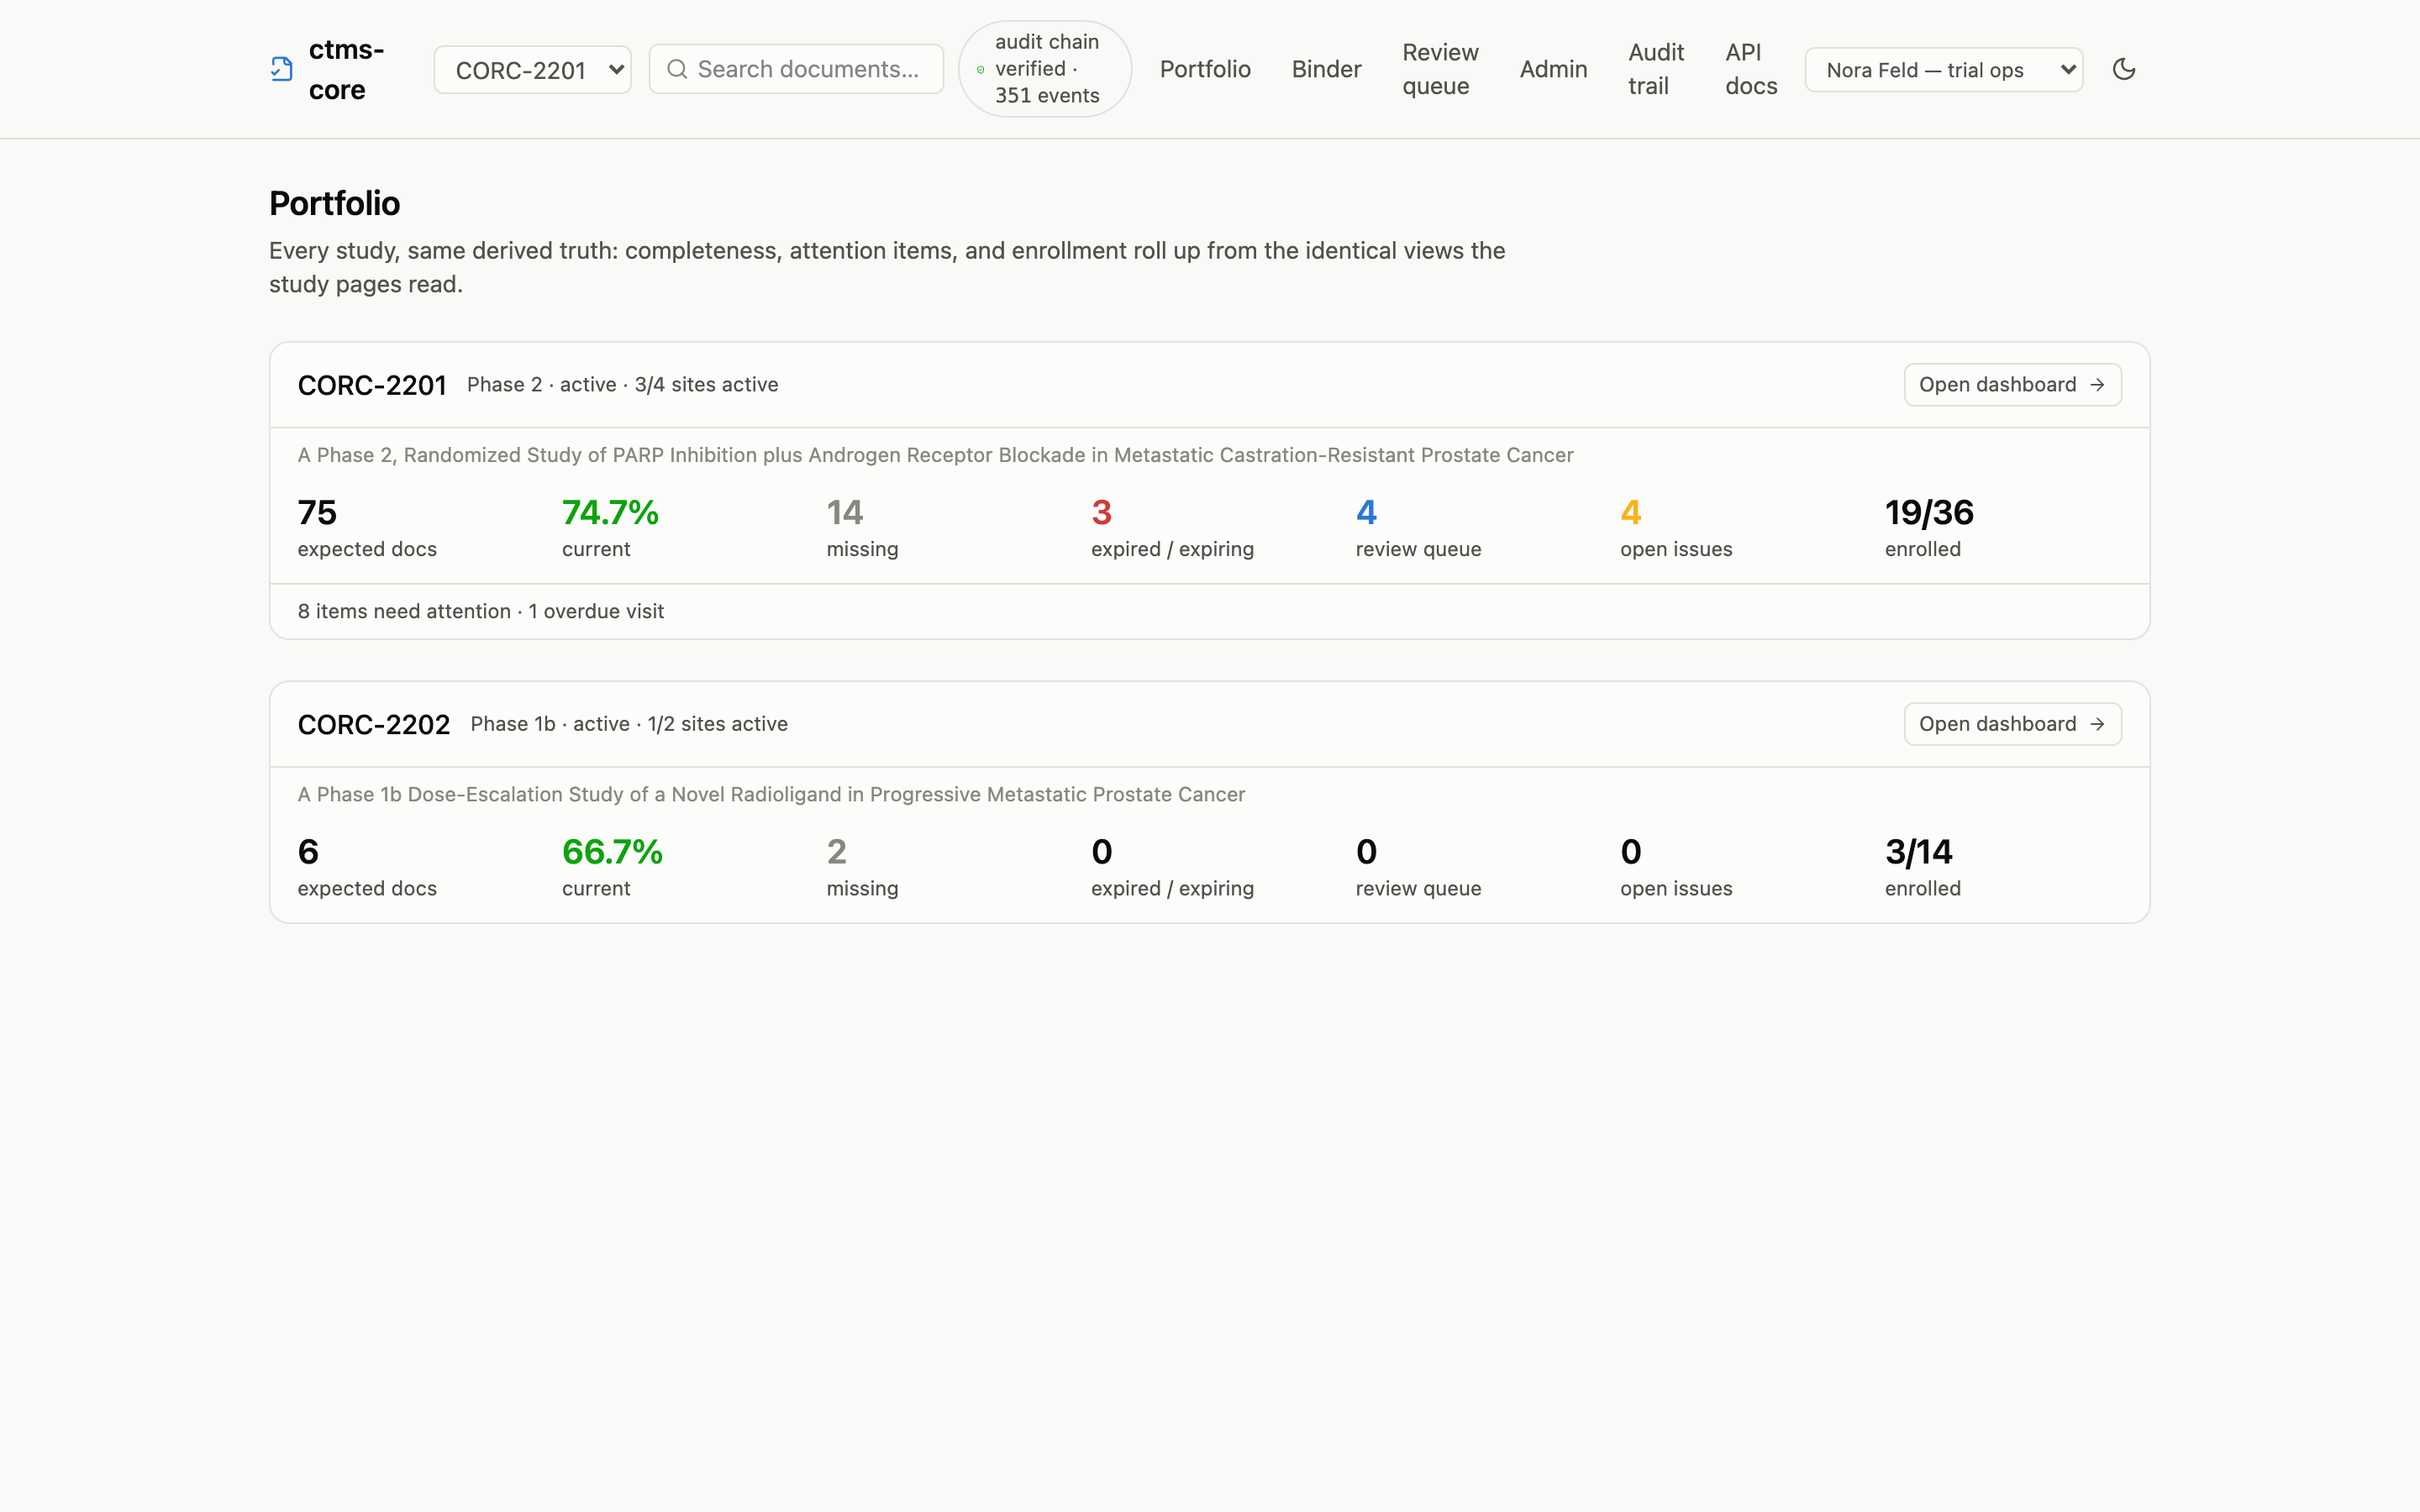
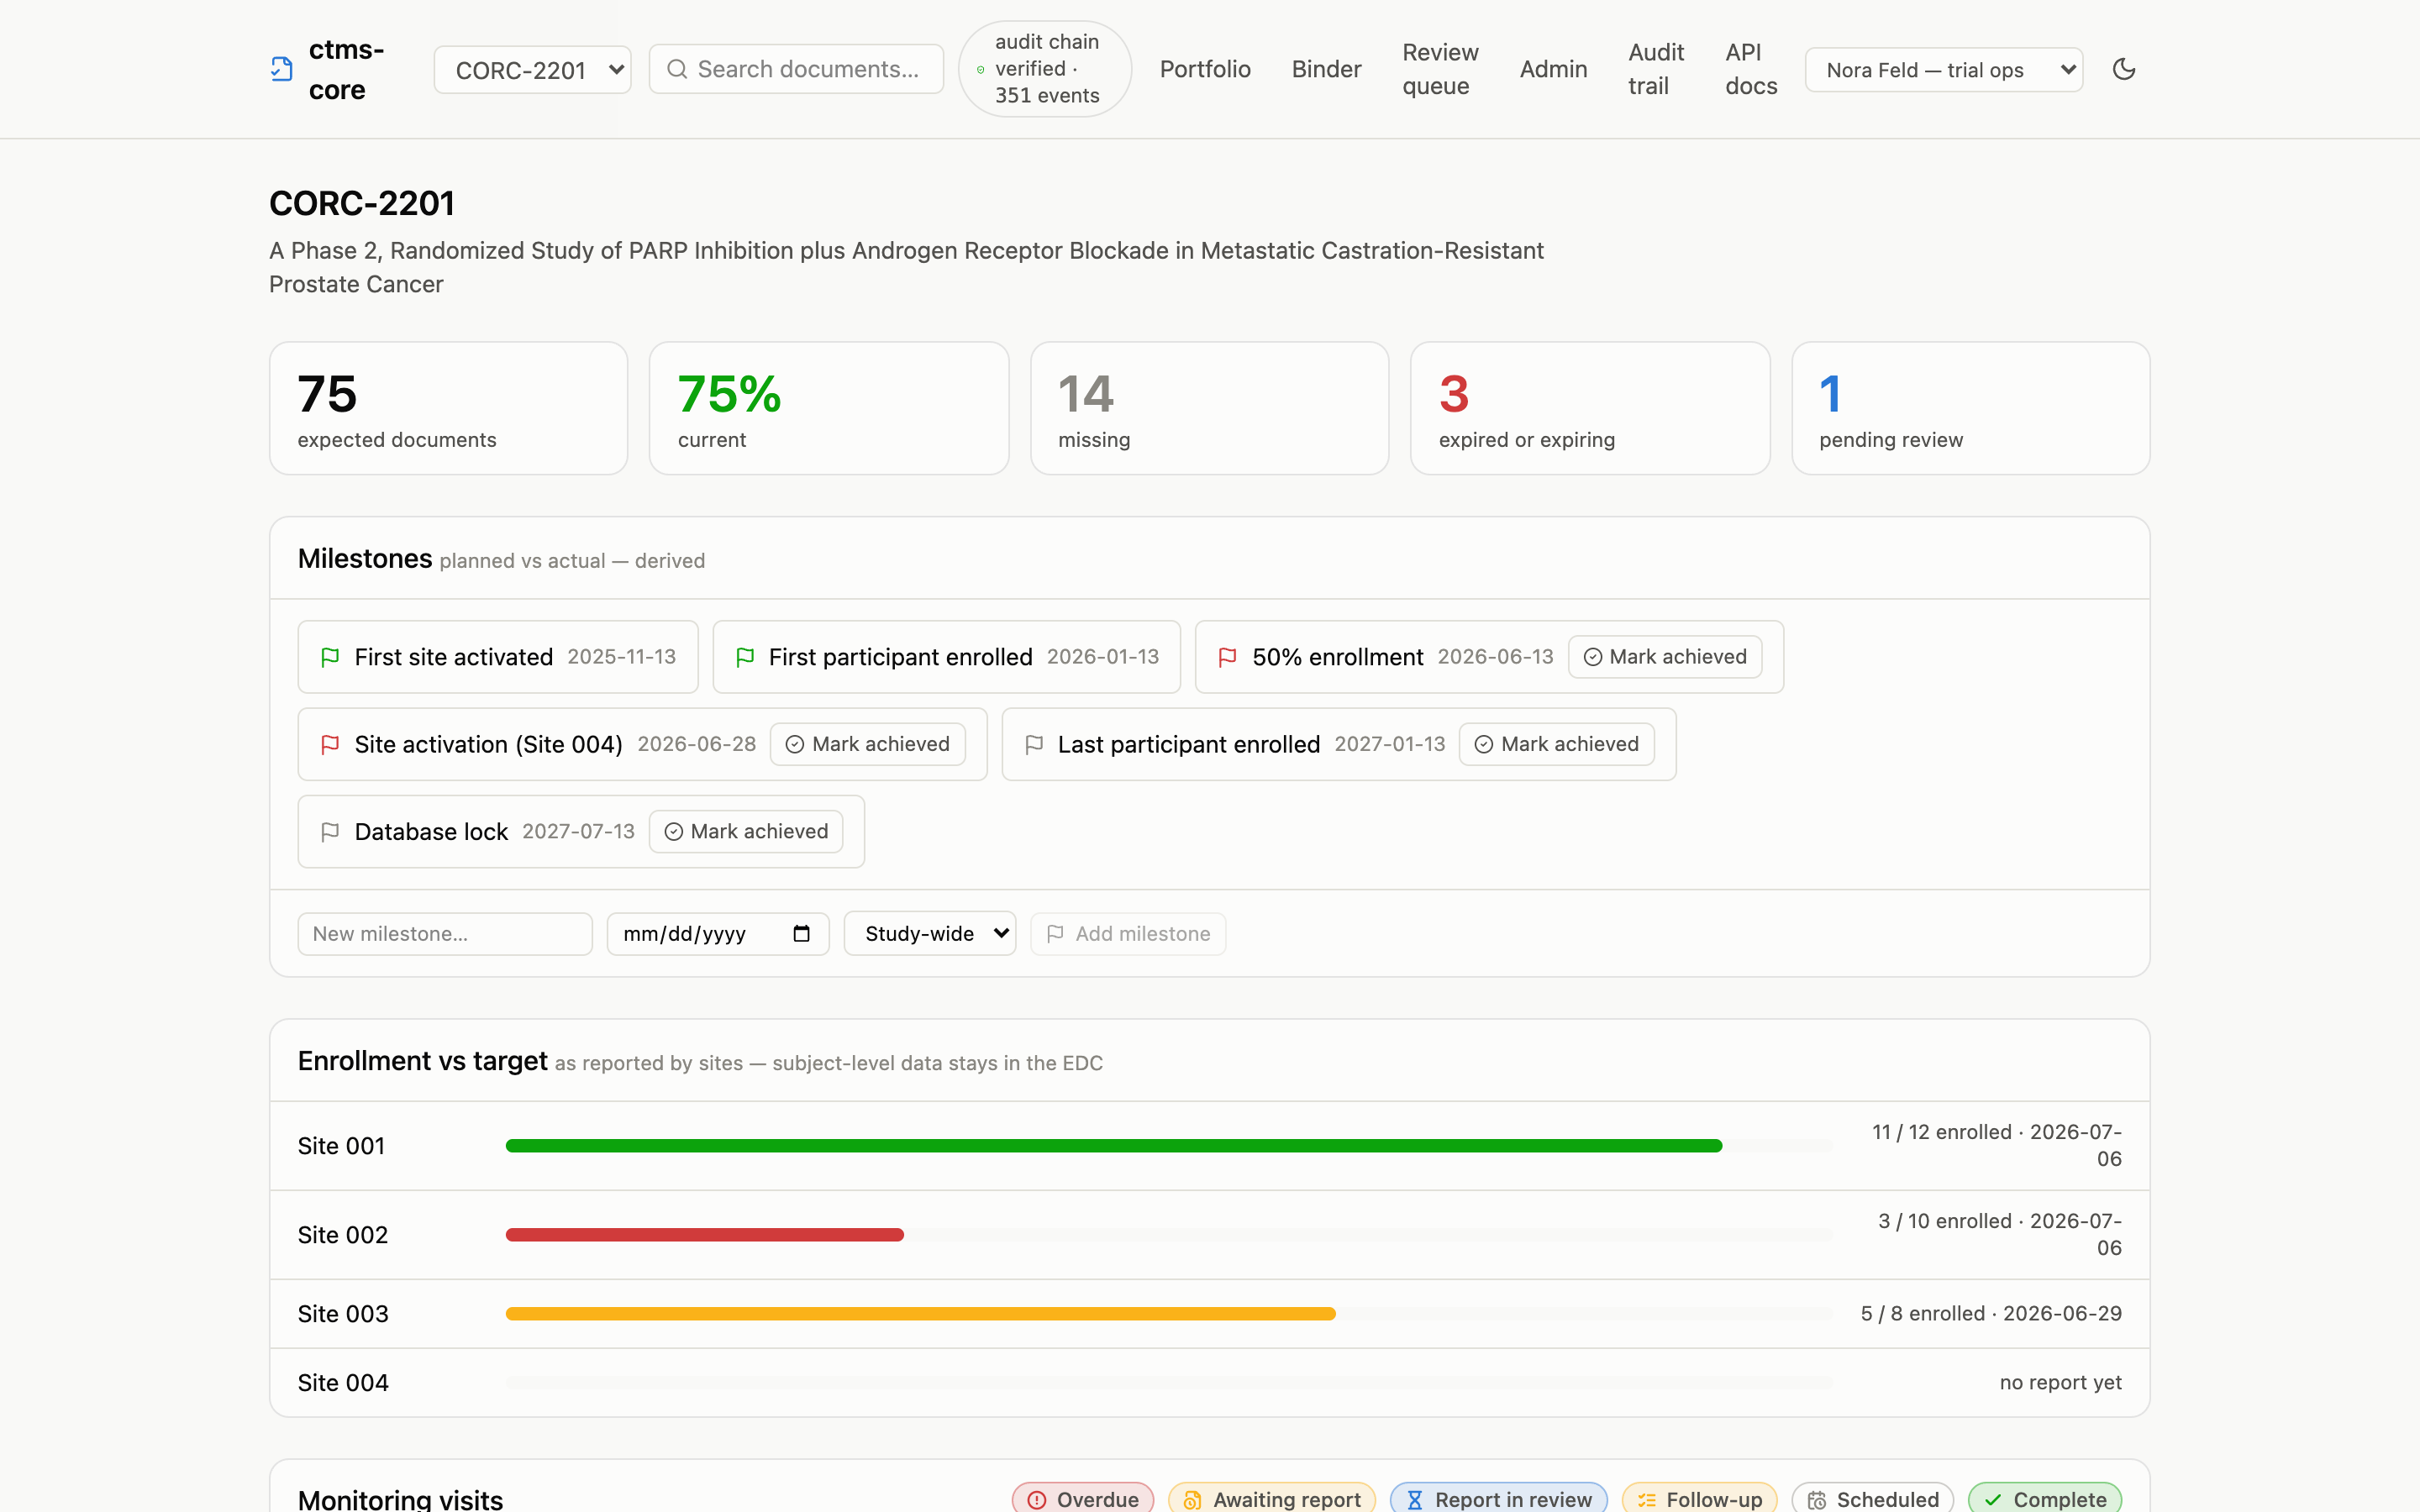
From top to bottom:
- The count tiles summarize document completeness: how many documents the study expects right now, what share are current, and how many are missing, expired or expiring, or waiting for review. These are totals of the same statuses you’ll see item by item further down.
- Milestones shows planned-versus-actual for the study’s key dates. Green means achieved, red means the planned date has passed, grey means upcoming. You can add milestones and mark them achieved right on this card; see enrollment and milestones.
- Enrollment vs target shows each site’s latest self-reported counts against its target. Sites report their own numbers on their site pages.
- Monitoring visits lists every visit with its current stage. The chips in the card header filter the list: click “Overdue” to see only visits that need attention. The monitoring visits page walks the full lifecycle.
- Issues & deviations lists findings and protocol deviations with severity and status, and includes the form for logging a new one; see issues and deviations.
- The site document matrix is the heart of the oversight view.
Reading the site document matrix
Each row is a required document; each column is a site. A cell shows the worst status for that requirement at that site. If three of four staff have current GCP certificates, the cell shows the one that’s missing, with a count.
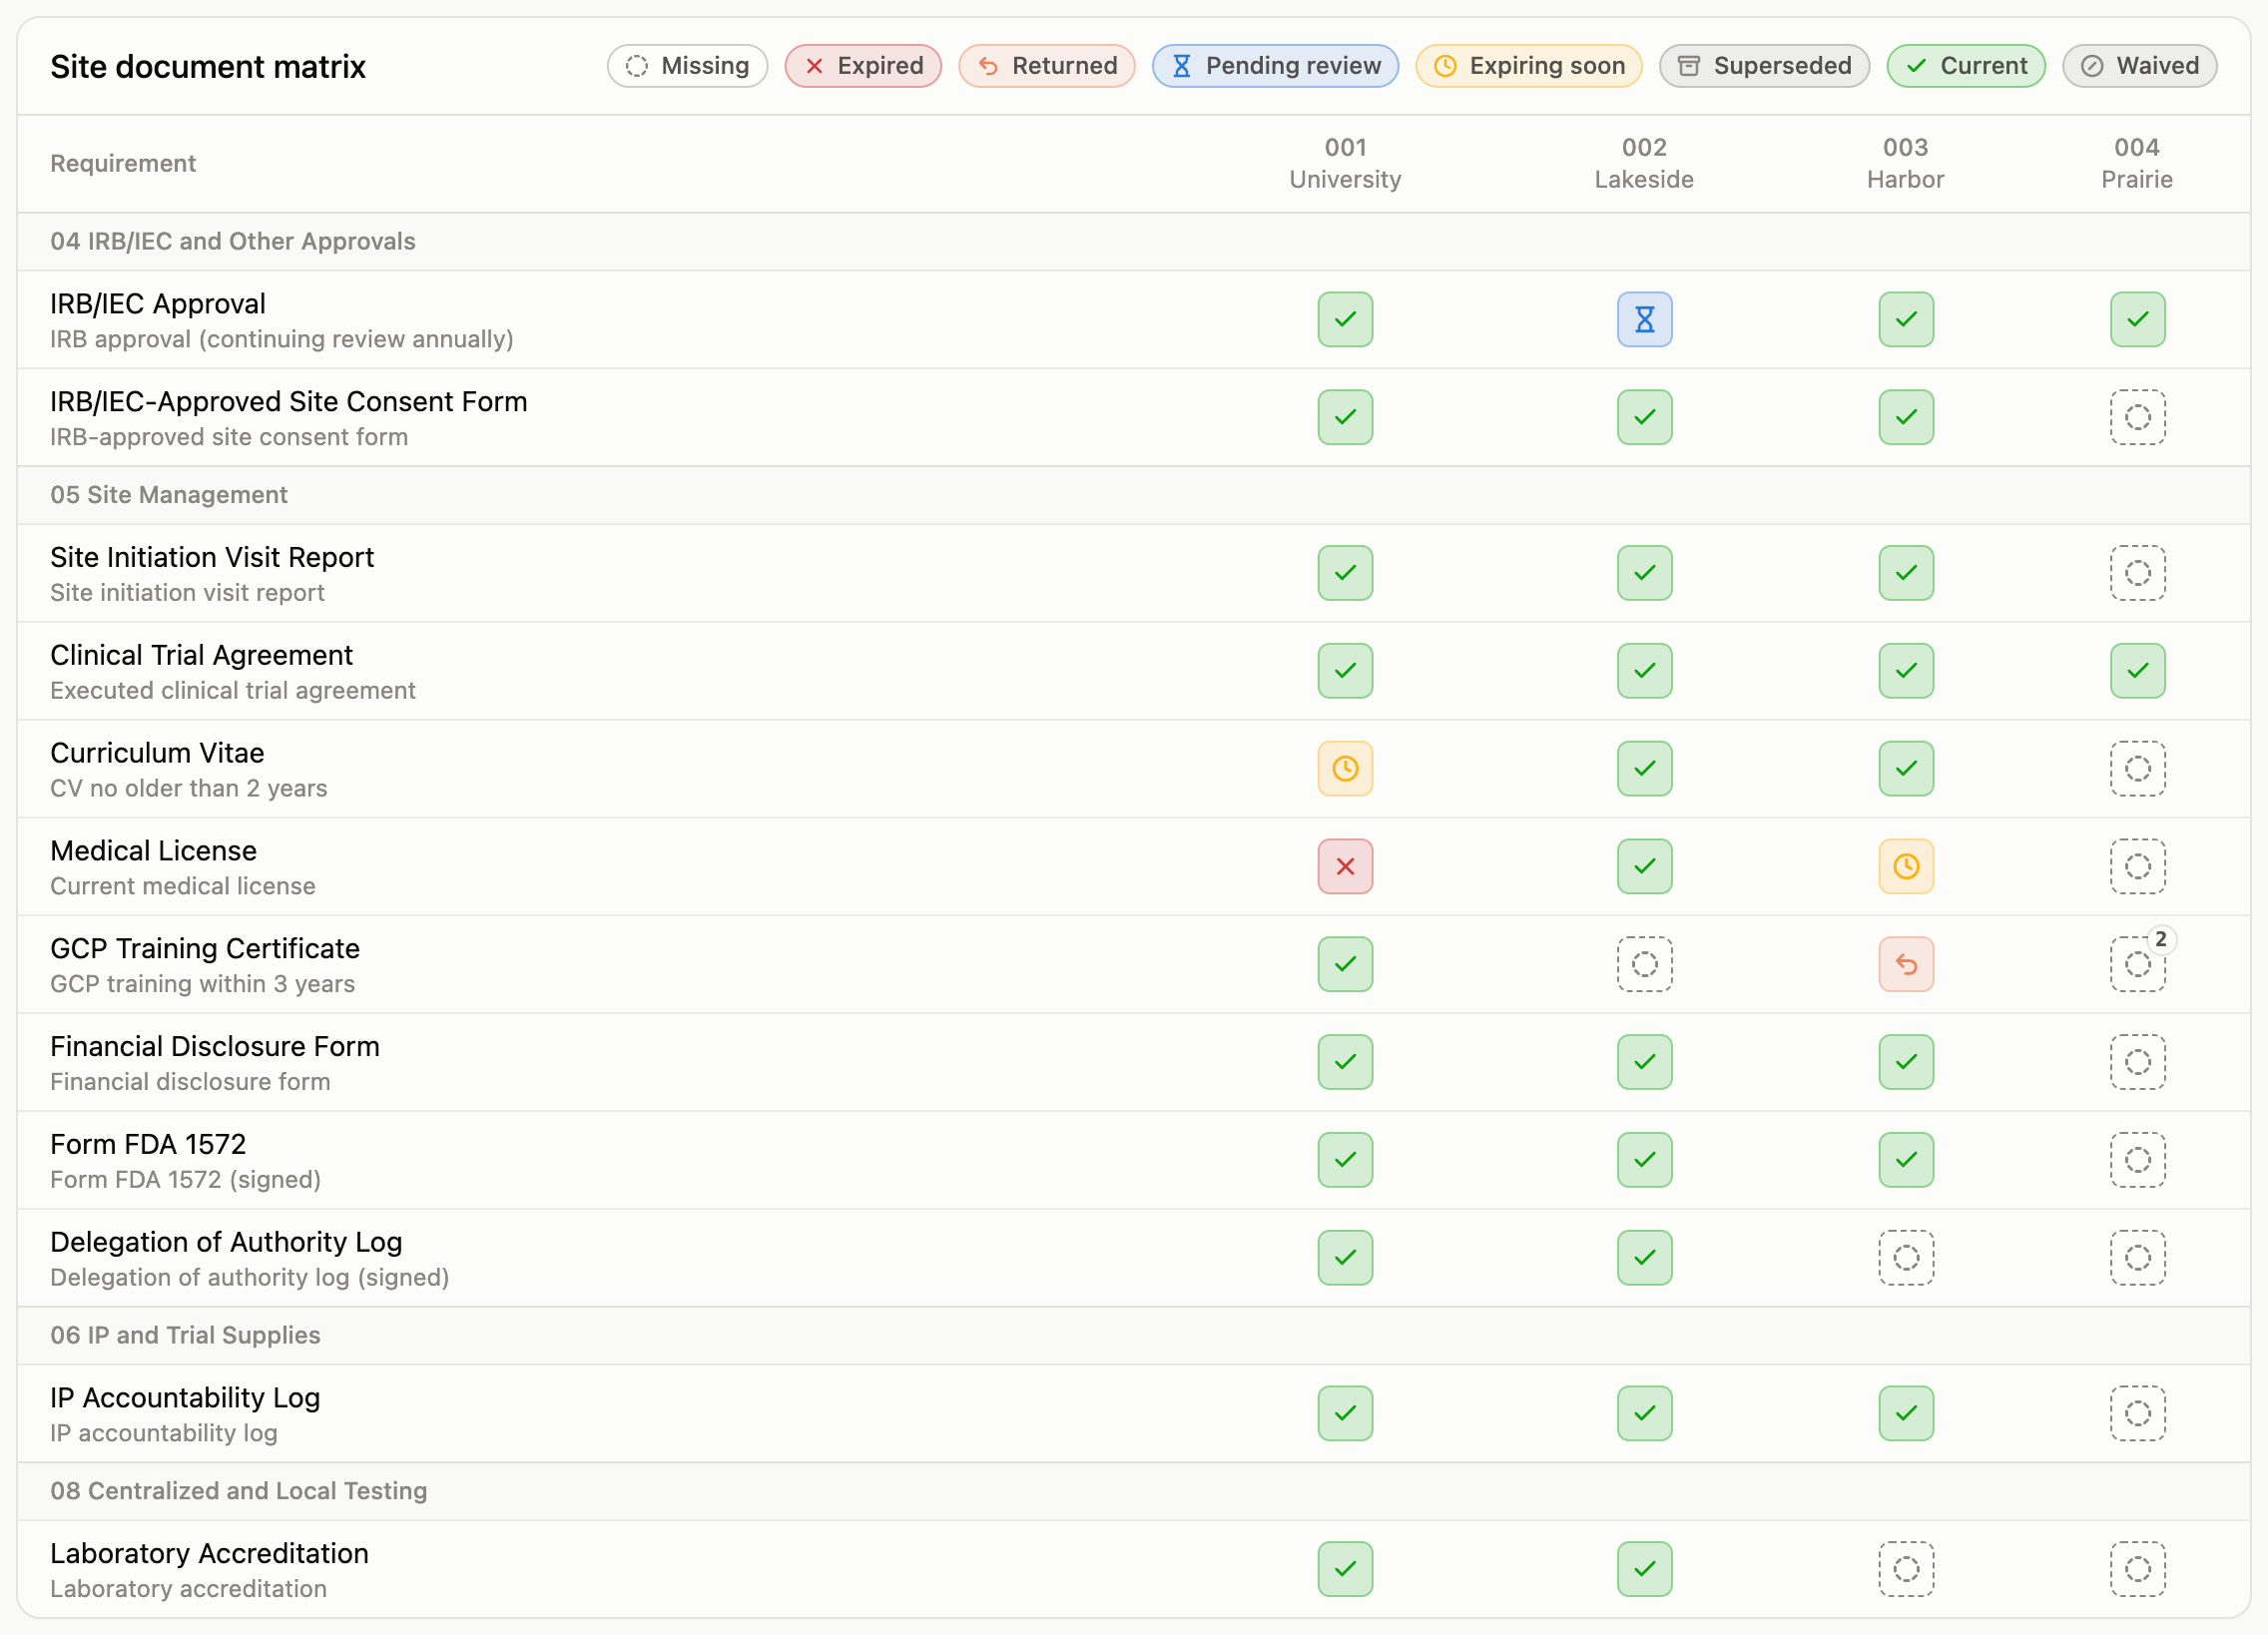
Hover any cell for the detail (who is missing what), and click it to land on the site’s page, where the fix (usually an upload) is one button away. Every status icon pairs a shape with a label, so nothing depends on color alone; the full set is listed in what the statuses mean.
The pages under the dashboard
- A site page (click any site) holds the site’s staff roster (each person with their role and a count of their open document items), plus the delegation of authority and training logs, visits, issues, enrollment reporting, and the site’s expected documents grouped by TMF zone, each with an upload button where one is needed.
- A visit page (click any visit) walks a monitoring visit from scheduled through conducted, trip report, action items, and completion.
- A document page (click any document) shows its versions, signatures, and complete history.
- The audit trail link in the header opens the study-wide record of every change ever made; see the audit trail, briefly.
One more thing lives in the header: a small badge reading audit chain verified, with a running count of recorded events. The app re-verifies the integrity of the entire audit trail as you work and shows the result at all times. If the record had ever been tampered with, the badge would read BROKEN. Clicking it opens the audit trail.
Who can do what
Every account (and every connected system) holds an access role, optionally limited to one study or one site. Oversight roles all see the same pages. What the role controls is actions, and the pages only offer the actions your role can actually perform: a monitor sees no approve button, a read-only seat sees no forms at all. The server checks again at the moment you act, so nothing rests on the page being right.
| Role | What it can do |
|---|---|
| Administrator | Everything below, plus study administration |
| Trial operations | Read, upload, sign, and approve documents |
| Monitor | Read, upload, and sign, but not approve |
| Read-only | View everything, change nothing (the auditor’s seat) |
| Site staff | Their own site only: read, upload, sign, and keep the site’s logs |
| Ingest | Read and upload only; held by connected systems, never people |
Three of these deserve a note. Read-only is how an auditor or inspector is given the run of the record without any risk of changing it; see the auditor’s seat for the binder and the byte verification that seat is built around. Site staff is the one role with a different surface: a person scoped to a single site lands on that site’s page and works entirely there; see the site seat and its logs. Ingest is for software: when another system (an EDC, for example) files documents automatically, it does so under this role, which can never sign or approve: an electronic signature always requires a person. See working with documents for how those filings appear.
Where to go next
- Working with documents — upload, review, sign, and version documents.
- Monitoring visits — the visit lifecycle, start to finish.
- Issues and deviations — logging and resolving findings.
- Enrollment and milestones — reporting counts and tracking key dates.
- Administration — onboarding sites, staffing them, granting access, adjusting requirement rules, and waiving expected documents.
- The site seat and its logs — the site-scoped view, and the delegation of authority and training logs.
- What the statuses mean — every chip in the app, and what to do about each.
- Glossary — the trial and system terms used throughout.