
The CONSORT statement asks trial reports to show participant flow through four stages: Enrollment, Allocation, Follow-up, and Analysis. The README example stops at allocation; this article builds the full four-stage template.
Stage 1: count the cohorts
trial_data ships with ggconsort: 1,200 patients screened
for a randomized trial of Drug A versus Drug B, with exclusion,
follow-up, and analysis indicators. Every box in the diagram is a
cohort, so we define them all up front — including the per-arm follow-up
and analysis subsets.
library(ggconsort)
library(dplyr)

study_cohorts <-
  trial_data |>
  cohort_start("Assessed for eligibility") |>
  cohort_define(
    consented = .full |> filter(declined != 1),
    chemonaive = consented |> filter(prior_chemo != 1),
    randomized = chemonaive |> filter(bone_mets != 1),
    excluded = anti_join(.full, randomized, by = "id"),
    excluded_declined = anti_join(.full, consented, by = "id"),
    excluded_chemo = anti_join(consented, chemonaive, by = "id"),
    excluded_mets = anti_join(chemonaive, randomized, by = "id"),
    arm_a = randomized |> filter(treatment == "Drug A"),
    arm_b = randomized |> filter(treatment == "Drug B"),
    arm_a_lost = arm_a |> filter(lost_to_followup == 1),
    arm_a_discontinued = arm_a |> filter(discontinued == 1),
    arm_b_lost = arm_b |> filter(lost_to_followup == 1),
    arm_b_discontinued = arm_b |> filter(discontinued == 1),
    arm_a_analyzed = arm_a |> filter(not_analyzed != 1),
    arm_a_not_analyzed = arm_a |> filter(not_analyzed == 1),
    arm_b_analyzed = arm_b |> filter(not_analyzed != 1),
    arm_b_not_analyzed = arm_b |> filter(not_analyzed == 1)
  ) |>
  cohort_label(
    consented = "Consented",
    chemonaive = "Chemotherapy naive",
    randomized = "Randomized",
    excluded = "Excluded",
    excluded_declined = "Declined to participate",
    excluded_chemo = "Prior chemotherapy",
    excluded_mets = "Bone metastasis",
    arm_a = "Allocated to arm A",
    arm_b = "Allocated to arm B",
    arm_a_lost = "Lost to follow-up",
    arm_a_discontinued = "Discontinued intervention",
    arm_b_lost = "Lost to follow-up",
    arm_b_discontinued = "Discontinued intervention",
    arm_a_analyzed = "Analysed",
    arm_a_not_analyzed = "Excluded from analysis",
    arm_b_analyzed = "Analysed",
    arm_b_not_analyzed = "Excluded from analysis"
  )
Stage 2: lay out the diagram
A box named after a cohort labels itself with that cohort’s label and
count, so most boxes need nothing but a name and a grid position. Two
label helpers cover the rest: cohort_count_bullets() builds
header-plus-bullets boxes (the exclusion reasons), and
cohort_count_adorn() pasted with <br>
builds plain multi-line boxes (the follow-up boxes, which have no header
line in the CONSORT template).
The stage badges — Enrollment, Allocation, Follow-up, Analysis — go
in the left margin. That’s the consort_stage_add() default:
a "margin" column just left of the leftmost box.
study_consort <- study_cohorts |>
  consort_box_add(
    "full", row = 1, label = cohort_count_adorn(study_cohorts, .full)
  ) |>
  consort_box_add(
    "excluded", row = 2, col = "side",
    label = cohort_count_bullets(
      study_cohorts, excluded,
      excluded_declined, excluded_chemo, excluded_mets
    )
  ) |>
  consort_box_add("randomized", row = 3) |>
  consort_box_add("arm_a", row = 4, col = -1) |>
  consort_box_add("arm_b", row = 4, col = 1) |>
  consort_box_add(
    "arm_a_followup", row = 5, col = -1,
    label = paste(
      cohort_count_adorn(study_cohorts, arm_a_lost, arm_a_discontinued),
      collapse = "<br>"
    )
  ) |>
  consort_box_add(
    "arm_b_followup", row = 5, col = 1,
    label = paste(
      cohort_count_adorn(study_cohorts, arm_b_lost, arm_b_discontinued),
      collapse = "<br>"
    )
  ) |>
  consort_box_add(
    "arm_a_analyzed", row = 6, col = -1,
    label = cohort_count_bullets(
      study_cohorts, arm_a_analyzed, arm_a_not_analyzed
    )
  ) |>
  consort_box_add(
    "arm_b_analyzed", row = 6, col = 1,
    label = cohort_count_bullets(
      study_cohorts, arm_b_analyzed, arm_b_not_analyzed
    )
  ) |>
  consort_arrow_add(start = "full", end = "randomized") |>
  consort_arrow_add(start = "full", end = "excluded") |>
  consort_arrow_add(start = "randomized", end = c("arm_a", "arm_b")) |>
  consort_arrow_add(start = "arm_a", end = "arm_a_followup") |>
  consort_arrow_add(start = "arm_b", end = "arm_b_followup") |>
  consort_arrow_add(start = "arm_a_followup", end = "arm_a_analyzed") |>
  consort_arrow_add(start = "arm_b_followup", end = "arm_b_analyzed") |>
  consort_stage_add("Enrollment", row = c(1, 3)) |>
  consort_stage_add("Allocation", row = 4) |>
  consort_stage_add("Follow-up", row = 5) |>
  consort_stage_add("Analysis", row = 6)
equal_columns = TRUE draws every box in a column at the
width of the column’s widest box, matching the uniform-width boxes of
the official template.
library(ggplot2)

study_consort |>
  ggplot() +
  geom_consort(equal_columns = TRUE) +
  theme_consort()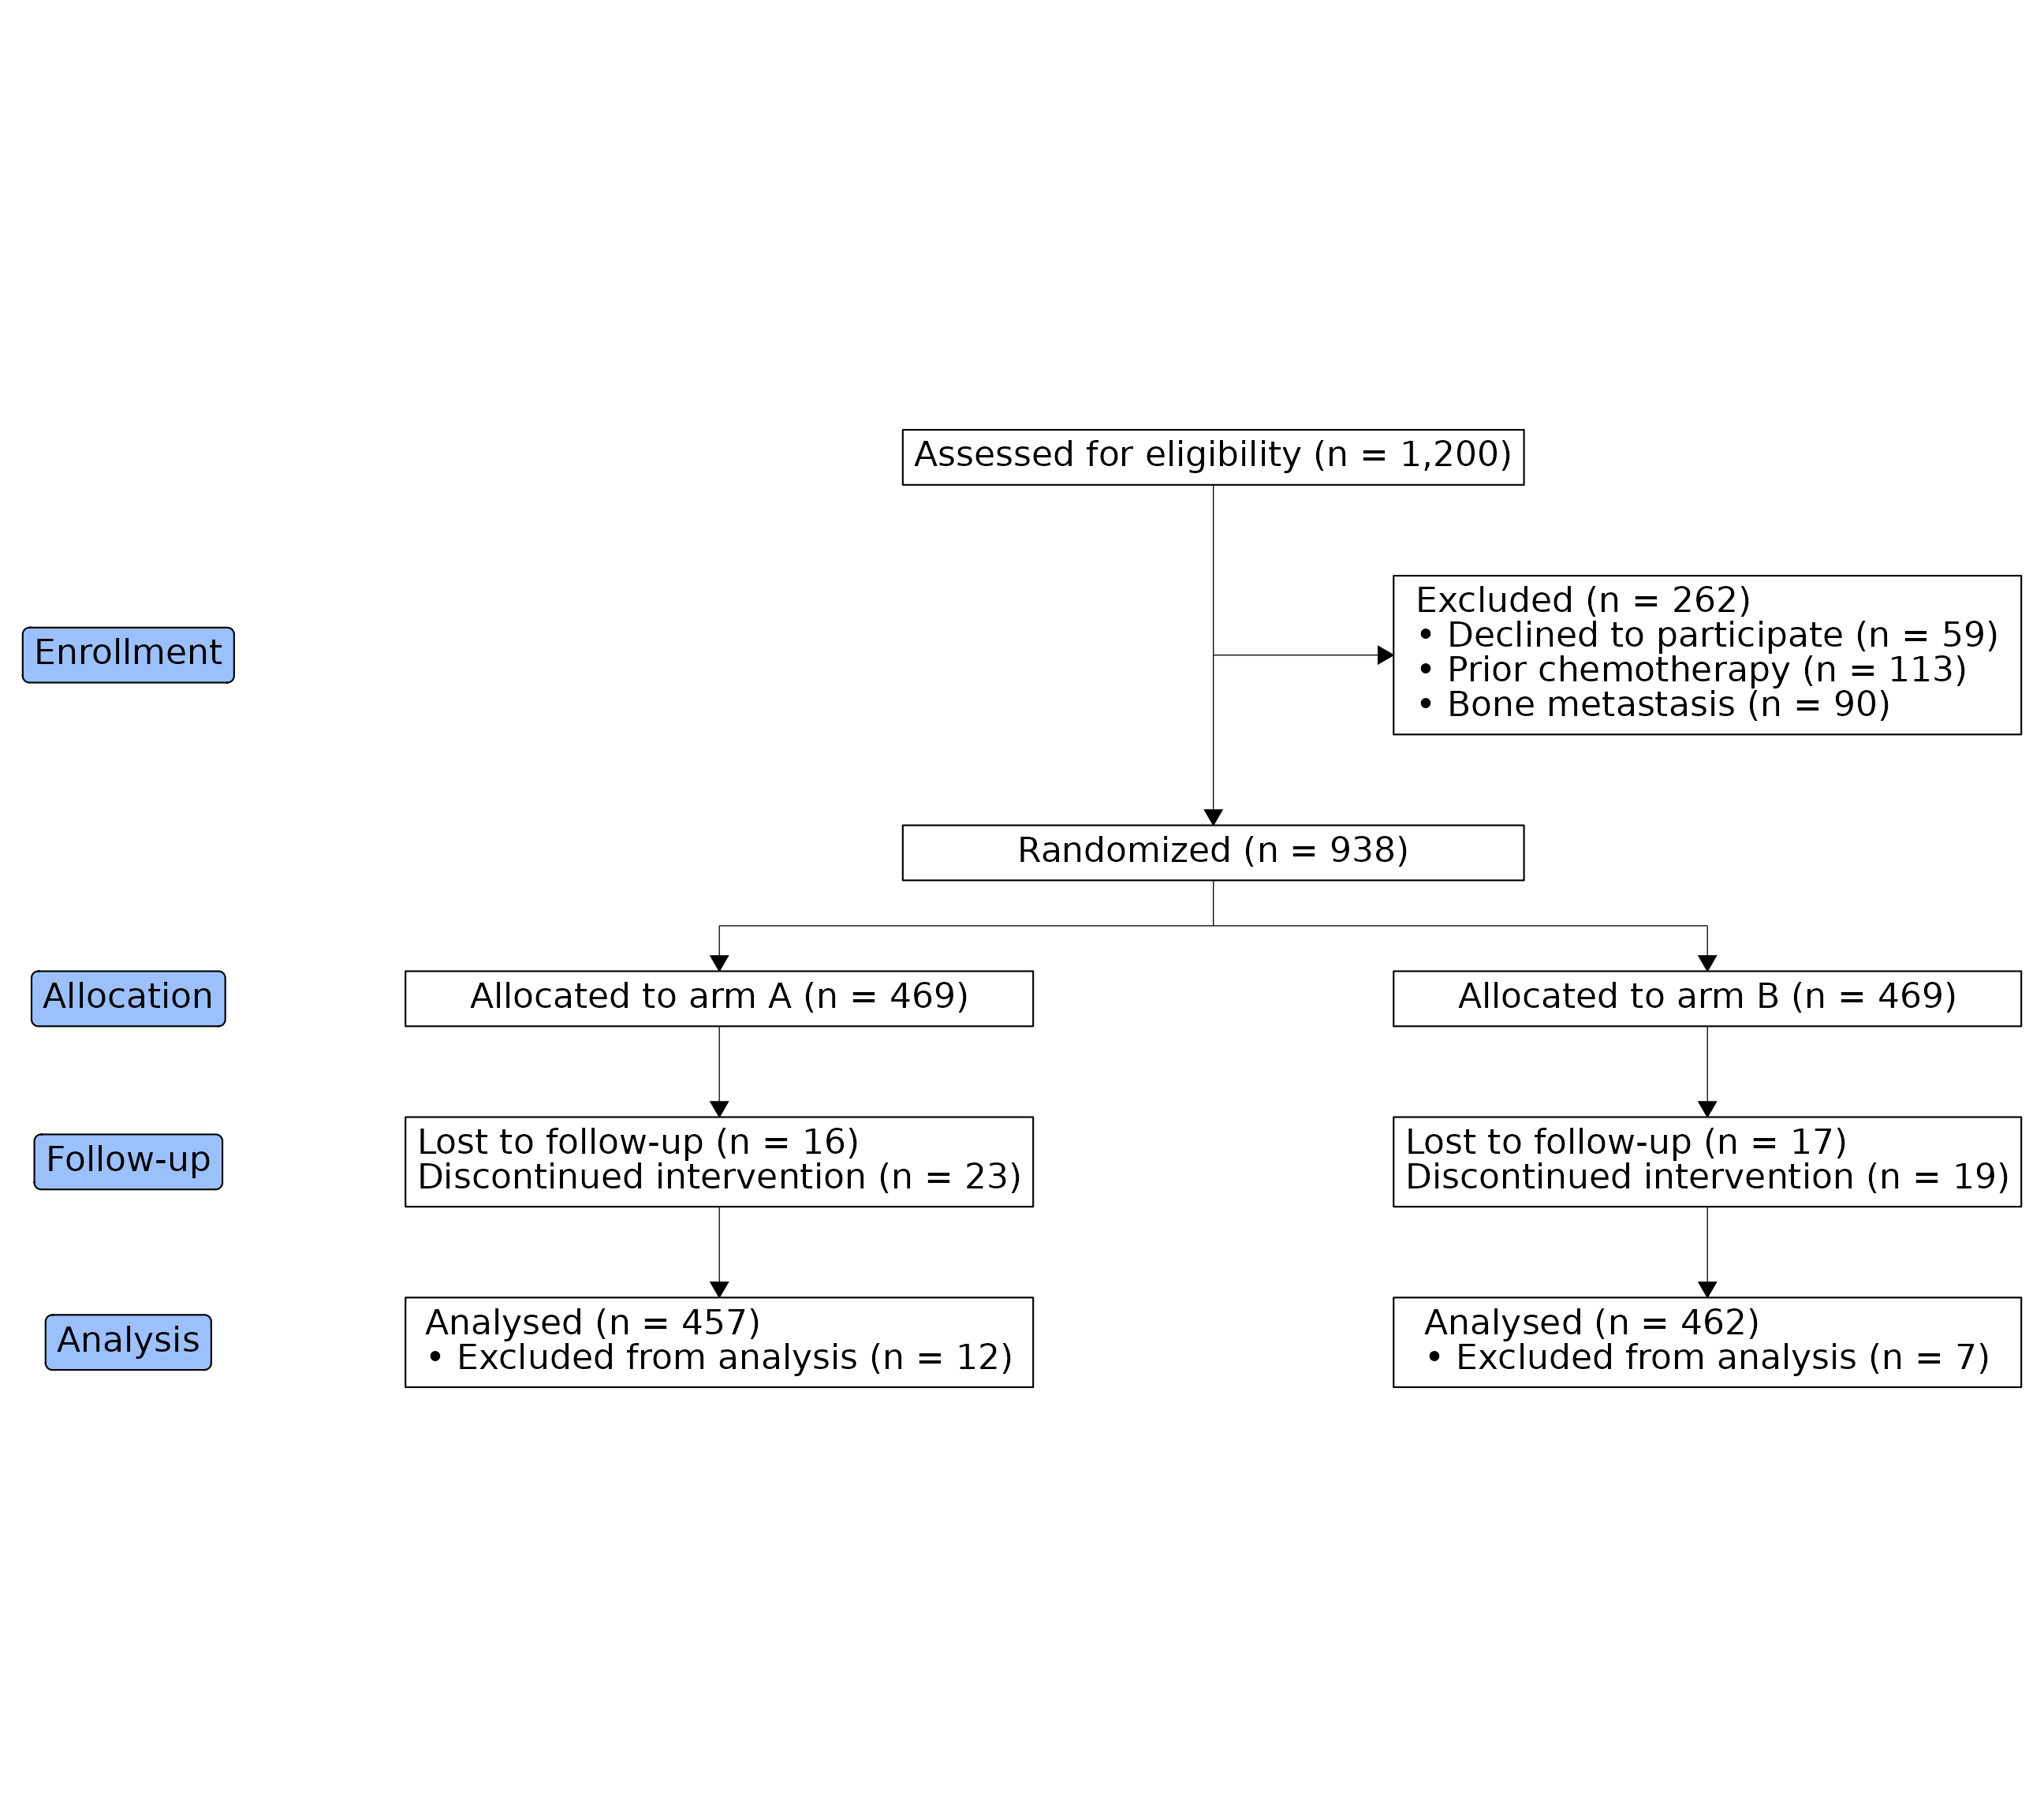
At analysis time, the analysis populations are one
cohort_pull() away:
study_cohorts |>
  cohort_pull(arm_a_analyzed)
#> # A tibble: 457 × 8
#>       id declined prior_chemo bone_mets treatment lost_to_followup discontinued
#>    <int>    <int>       <int>     <int> <chr>                <int>        <int>
#>  1 65464        0           0         0 Drug A                   0            0
#>  2 92586        0           0         0 Drug A                   0            0
#>  3 89052        0           0         0 Drug A                   0            0
#>  4 80724        0           0         0 Drug A                   0            0
#>  5 48837        0           0         0 Drug A                   0            0
#>  6 57285        0           0         0 Drug A                   0            0
#>  7 65239        0           0         0 Drug A                   0            1
#>  8 84443        0           0         0 Drug A                   0            0
#>  9 27997        0           0         0 Drug A                   0            0
#> 10 58752        0           0         0 Drug A                   0            0
#> # ℹ 447 more rows
#> # ℹ 1 more variable: not_analyzed <int>