A wrapper around ggplot2::theme_void() that adds plot margins. Margins
give diagrams with explicit x/y coordinates breathing room so boxes
near the edges are not clipped; row/column layouts size themselves to the
device and rarely need them.
Arguments
- margin_h, margin_v
Horizontal and vertical plot margins.
- margin_unit
Unit of the margins, passed to
ggplot2::margin().
Examples
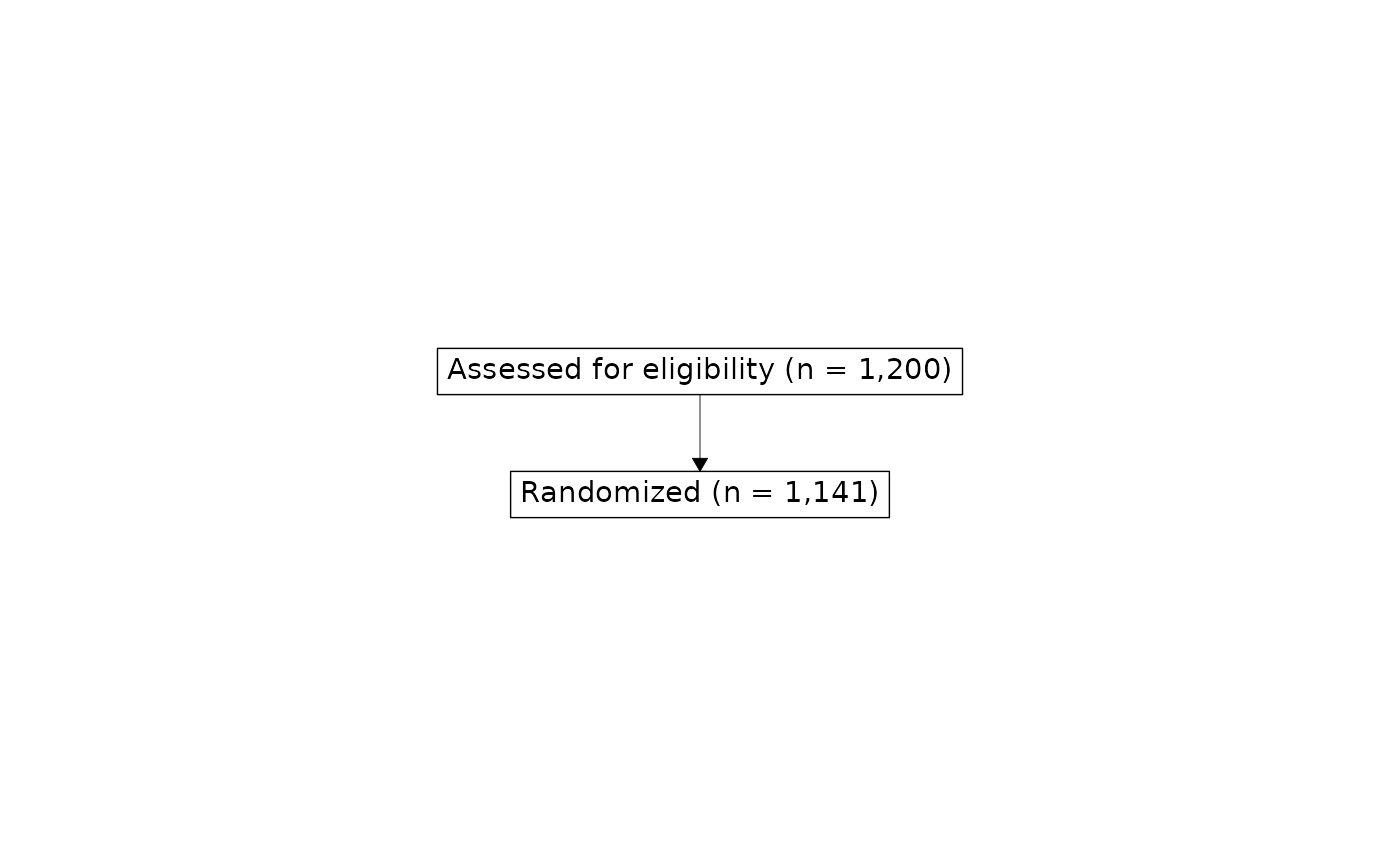
cohorts <- trial_data |>
  cohort_start("Assessed for eligibility") |>
  cohort_define(
    randomized = .full |> dplyr::filter(declined != 1)
  ) |>
  cohort_label(randomized = "Randomized")

consort <- cohorts |>
  consort_box_add("full", row = 1, label = cohort_count_adorn(cohorts, .full)) |>
  consort_box_add("randomized", row = 2, label = cohort_count_adorn(cohorts, randomized)) |>
  consort_arrow_add(start = "full", end = "randomized")

library(ggplot2)
ggplot(consort) +
  geom_consort() +
  theme_consort()