Draws snapshot history in one of two layouts. With a table_name, a
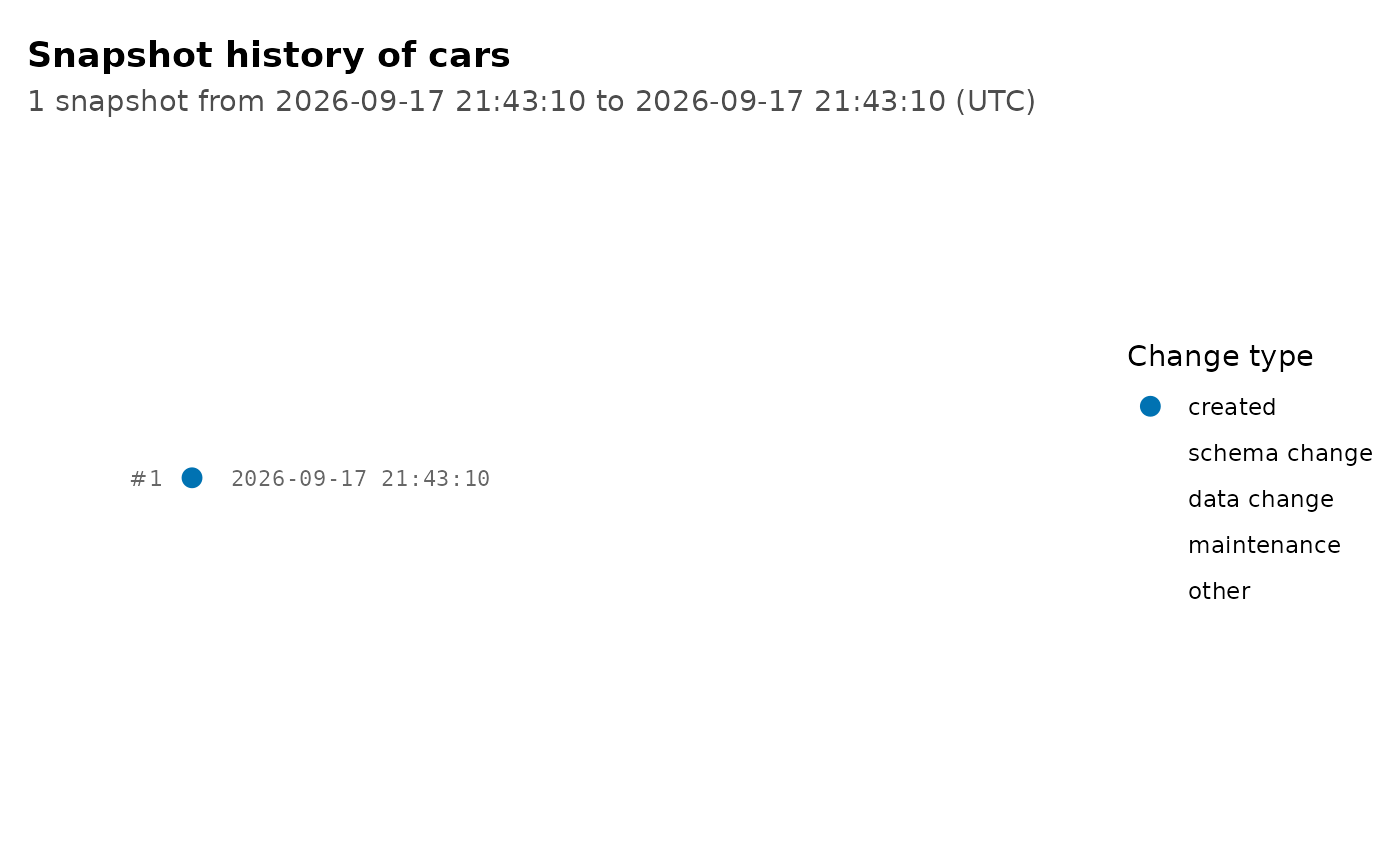
commit-log timeline: one row per snapshot (newest at top) on an ordinal
spine, with the timestamp, author, and commit message as aligned text and
long idle stretches marked inline (e.g. "103 days later") instead of
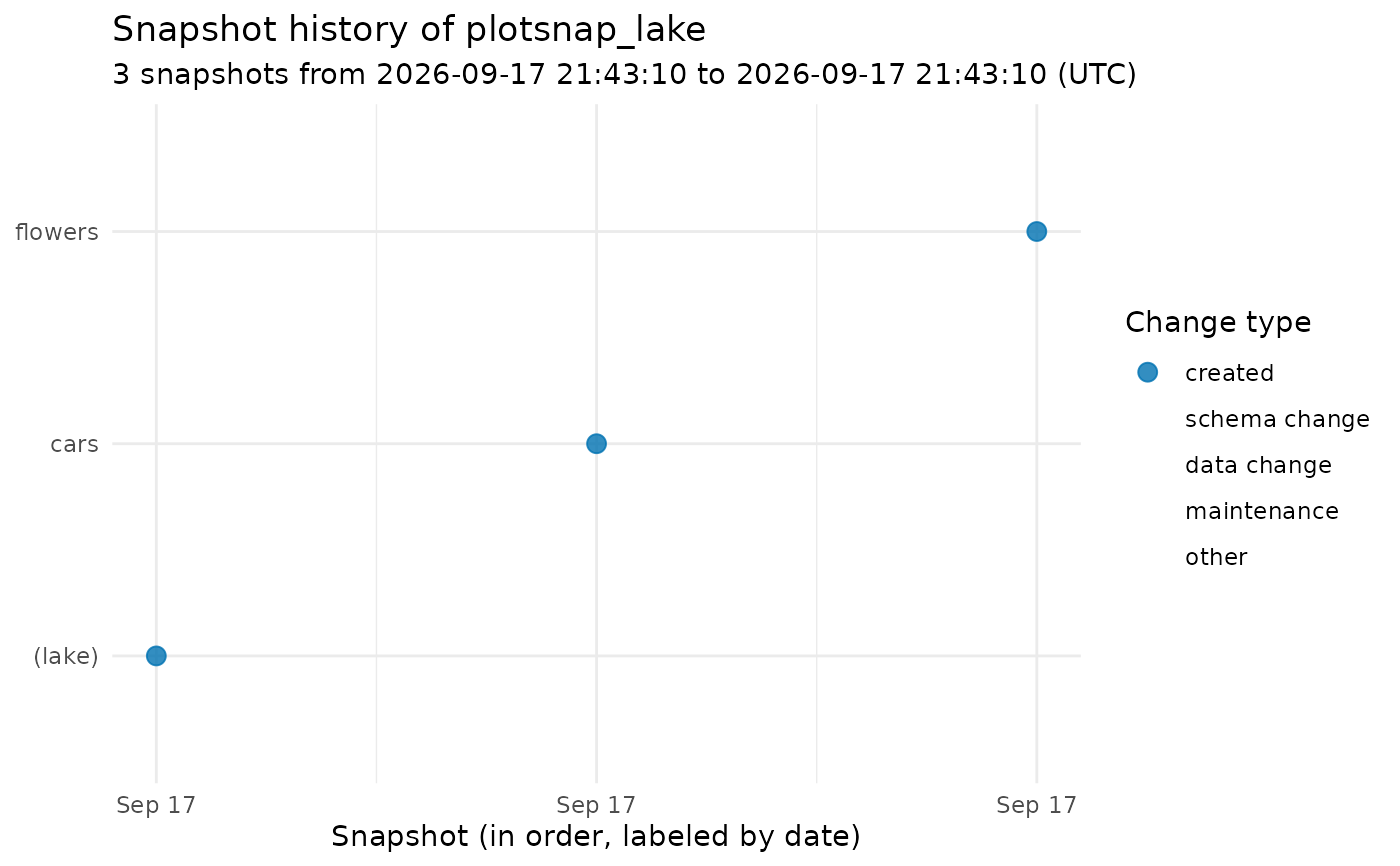
stretching an axis. Without a table_name, a lake-wide swimlane: one row
per table, one point per snapshot, evenly spaced in snapshot order, so
active and stale tables read at a glance.
Details
Requires the ggplot2 package (listed in Suggests). Snapshot data comes from
list_table_snapshots(); each snapshot is classified from the entries of
its changes column that name the table into one of: created, schema
change, data change, maintenance, or other. A transaction that updates
one table in place and rebuilds another therefore shows a data change on
the first and a creation on the second. Authors and commit messages
appear where they were recorded (see set_snapshot_metadata() and
commit_transaction()).
Both layouts position snapshots by order rather than by clock time, so a
history with months of silence between bursts of activity stays readable.
In the swimlane, snapshots that touch no table (like the initial schema
creation) appear in a (lake) lane, and the x axis labels show each
snapshot's date. Lanes carry schema-qualified names when the lake keeps
tables outside main, so bronze.dm and silver.dm stay apart.
Examples
lake_dir <- tempfile("plotsnap_lake_")
dir.create(lake_dir)
attach_ducklake("plotsnap_lake", lake_path = lake_dir)
create_table(mtcars, "cars")
create_table(iris, "flowers")
#> Converted factor column Species to character (DuckLake does not support ENUM
#> columns).
# Commit-log timeline of one table's history
plot_snapshots("cars")
 # Swimlane of every table in the lake
plot_snapshots()
# Swimlane of every table in the lake
plot_snapshots()
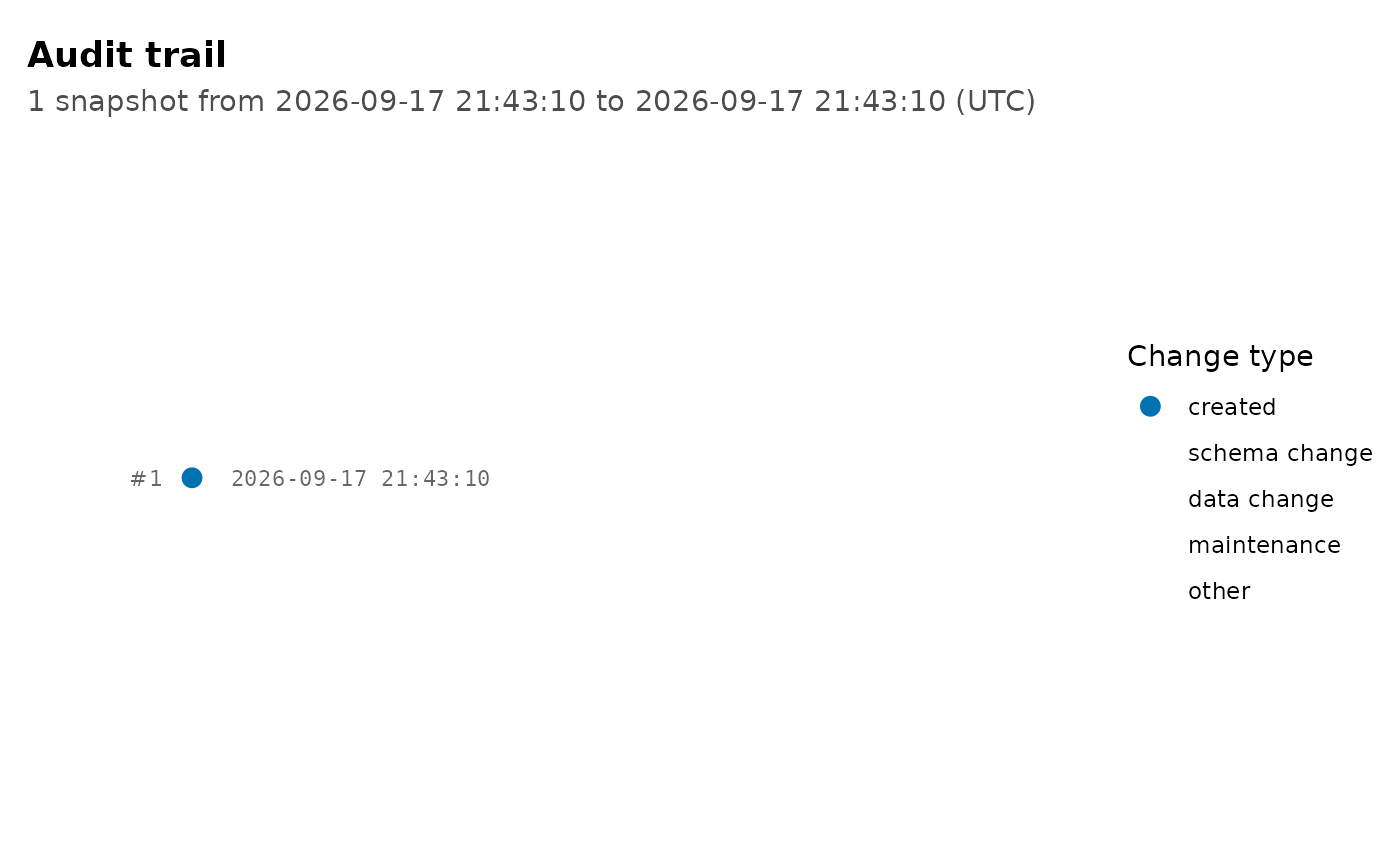
 # Customize the result like any ggplot
plot_snapshots("cars") +
ggplot2::labs(title = "Audit trail")
# Customize the result like any ggplot
plot_snapshots("cars") +
ggplot2::labs(title = "Audit trail")
 detach_ducklake("plotsnap_lake", shutdown = TRUE)
unlink(lake_dir, recursive = TRUE)
detach_ducklake("plotsnap_lake", shutdown = TRUE)
unlink(lake_dir, recursive = TRUE)