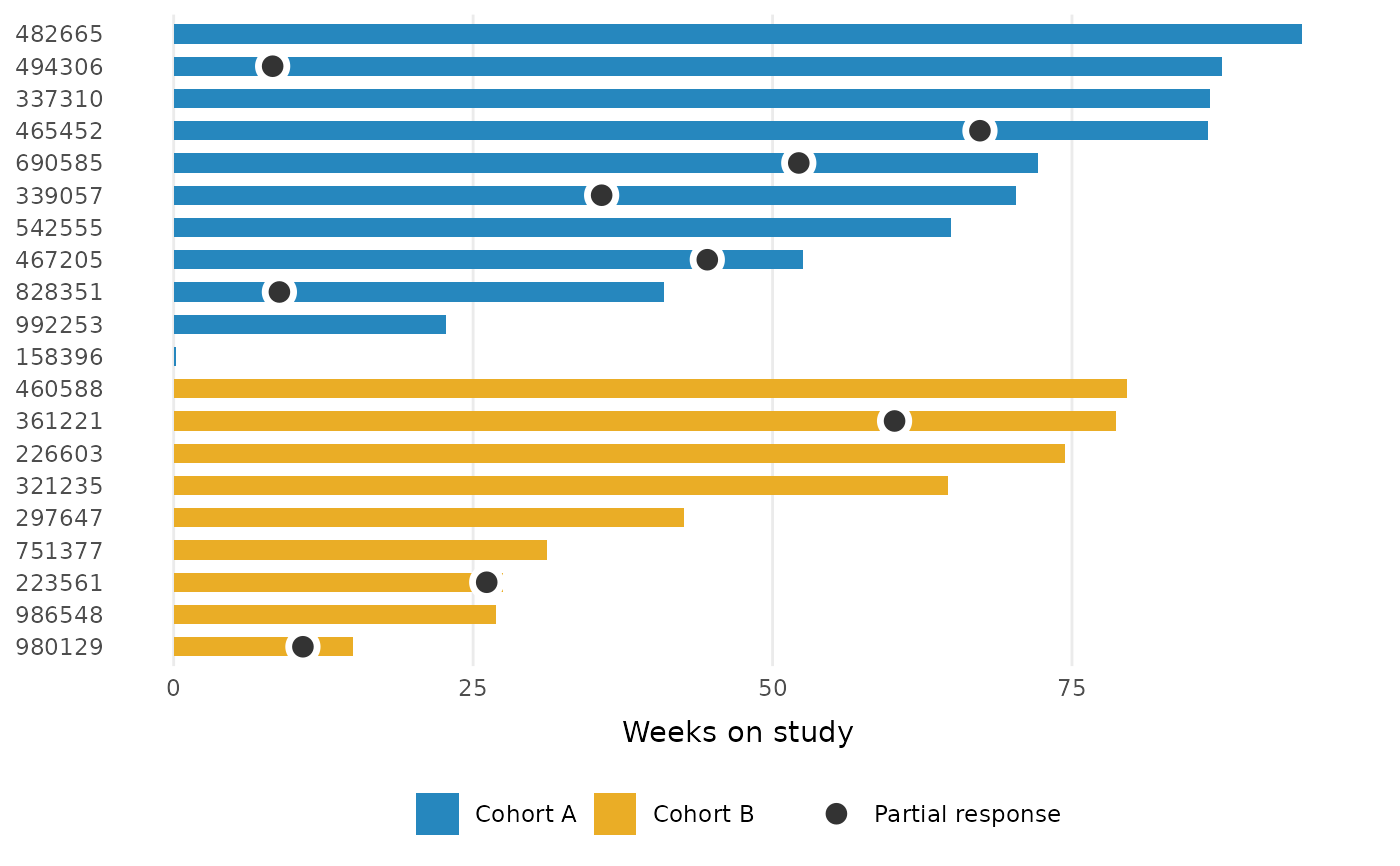
Draws a shaped point on each lane at the time of an event (e.g. partial
response). Subjects with NA in time_var are skipped. Supply
marker_label to add the marker to the shared shape legend, or
marker_var to map several event types to different shapes.
Usage
geom_swimlane_marker(
  id_var,
  time_var,
  marker_var = NULL,
  marker_label = NULL,
  size = 2.8,
  colour = "grey20",
  fill = colour,
  stroke = 0.75,
  halo = "white",
  ...
)
Arguments
- id_var
Column with the subject identifier, mapped to the y-axis.
- time_var
Numeric column with the event time, mapped to the x-axis.
NAmeans no event for that subject.- marker_var
Optional column mapped to shape, for data with several event types. Cannot be combined with
marker_label.- marker_label
Optional string naming this event in the shape legend (e.g.
"Partial response"). Cannot be combined withmarker_var.- size
Point size.
- colour
Point color, used for both the outline and (by default) the fill of the glyph.
- fill
Fill color for the solid glyphs (shapes 21-25). Defaults to
colour.- stroke
Outline width of the glyph.
- halo
Color of the ring drawn beneath each glyph, separating it from the bar fill. Use
NAto disable (e.g. on dark backgrounds).- ...
Other arguments passed to
ggplot2::geom_point().
Examples
library(ggplot2)

patient_disposition |>
  order_swimlane(subject, weeks_on_study, cohort) |>
  ggplot() +
  geom_swimlane(subject, weeks_on_study, cohort) +
  geom_swimlane_marker(
    subject, partial_response,
    marker_label = "Partial response"
  ) +
  labs(x = "Weeks on study") +
  theme_swimlane()