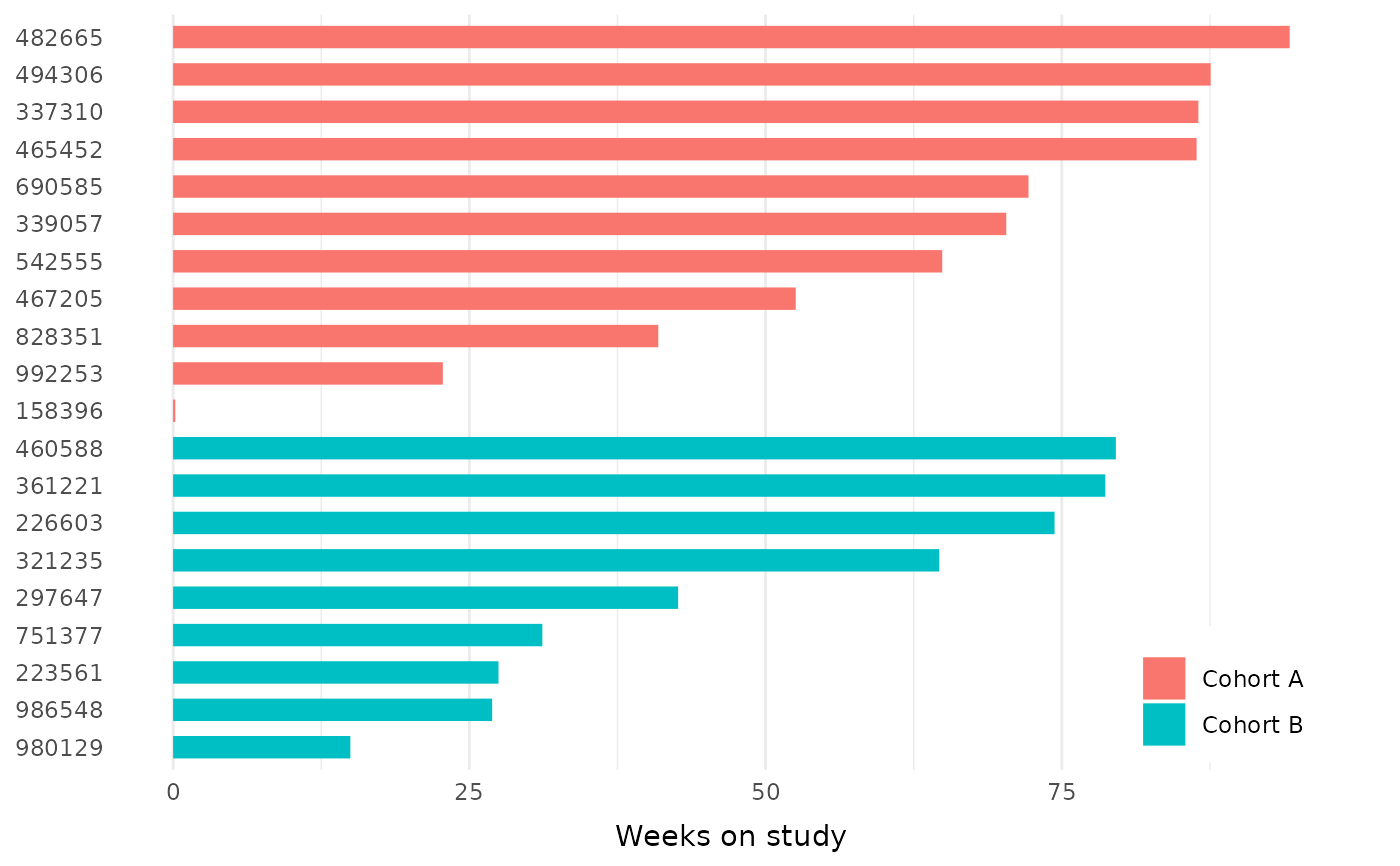
Swimlane charts
geom_swimlane.RdA geom for swimlane plots
geom_swimlane(id_var, duration_var, cohort_var = NULL, ...)Arguments
- id_var
Column name for subject identifier
- duration_var
Column name for numeric length of time on study
- cohort_var
Optional column name to sort by cohort
- ...
Other options passed to geom_bar
Value
A ggplot2 compatible geom
Examples
library(ggplot2)

patient_disposition %>%
  order_swimlane(subject, weeks_on_study, cohort) %>%
  ggplot() +
  geom_swimlane(subject, weeks_on_study, cohort) +
  theme_swimlane(legend.position = c(.9, .1)) +
  ylab("Weeks on study")