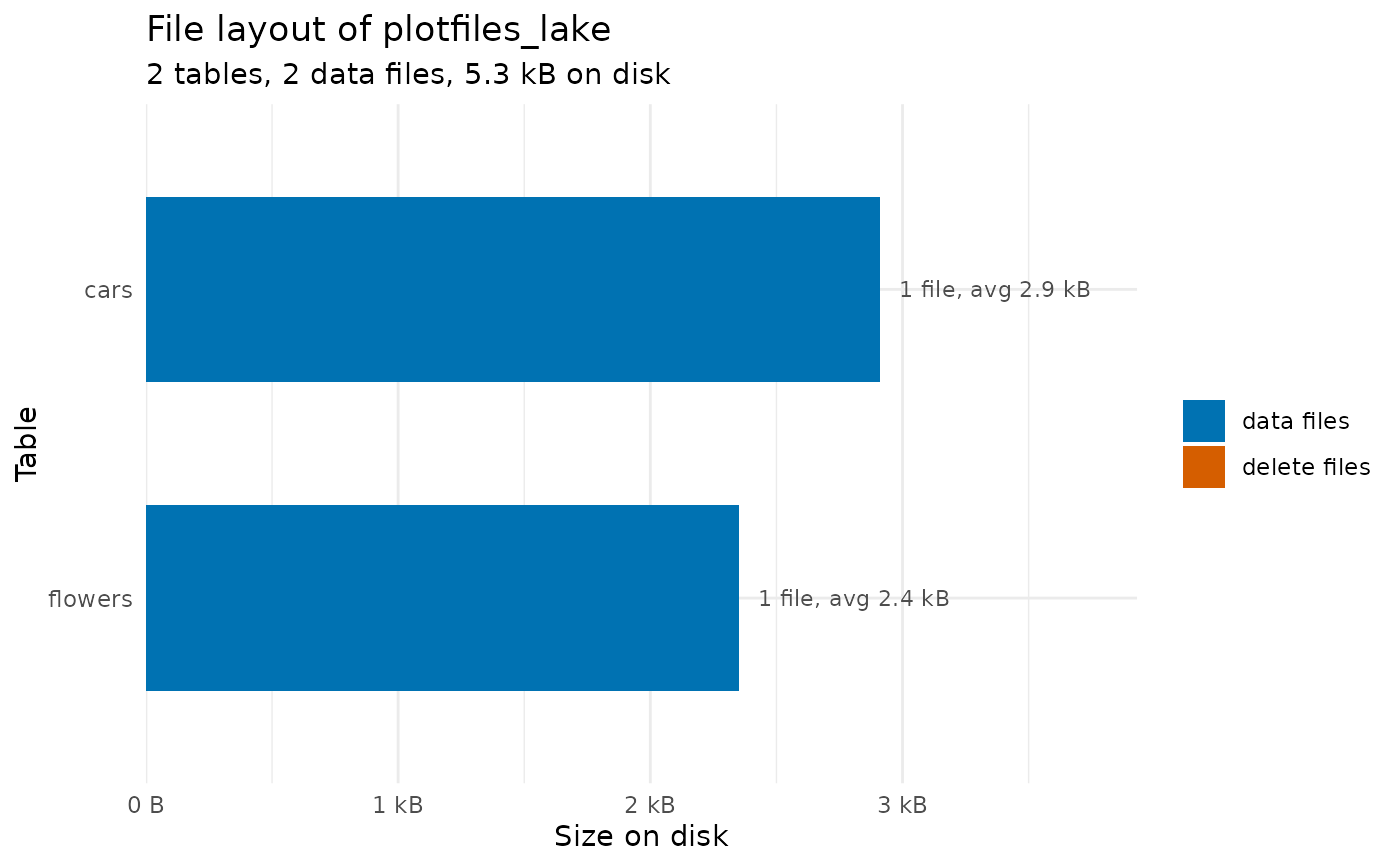
Draws each table's storage footprint as a horizontal bar: total bytes of Parquet data files, with delete files stacked in a second color, and a label giving the file count and average file size. Useful for spotting fragmentation – many small files – before it slows scans down.
Details
Requires the ggplot2 package (listed in Suggests). File statistics come
from get_table_info(). Tables whose rows are still inlined in the
catalog have no data files yet and show an empty bar; run
flush_inlined_data() to write them out. Many small files can be
compacted with merge_adjacent_files(), and a large delete-file share is
a sign to run rewrite_data_files().
Examples
lake_dir <- tempfile("plotfiles_lake_")
dir.create(lake_dir)
attach_ducklake("plotfiles_lake", lake_path = lake_dir)
create_table(mtcars, "cars")
create_table(iris, "flowers")
#> Converted factor column Species to character (DuckLake does not support ENUM
#> columns).
# File counts and sizes for every table in the lake
plot_table_files()
 # Customize the result like any ggplot
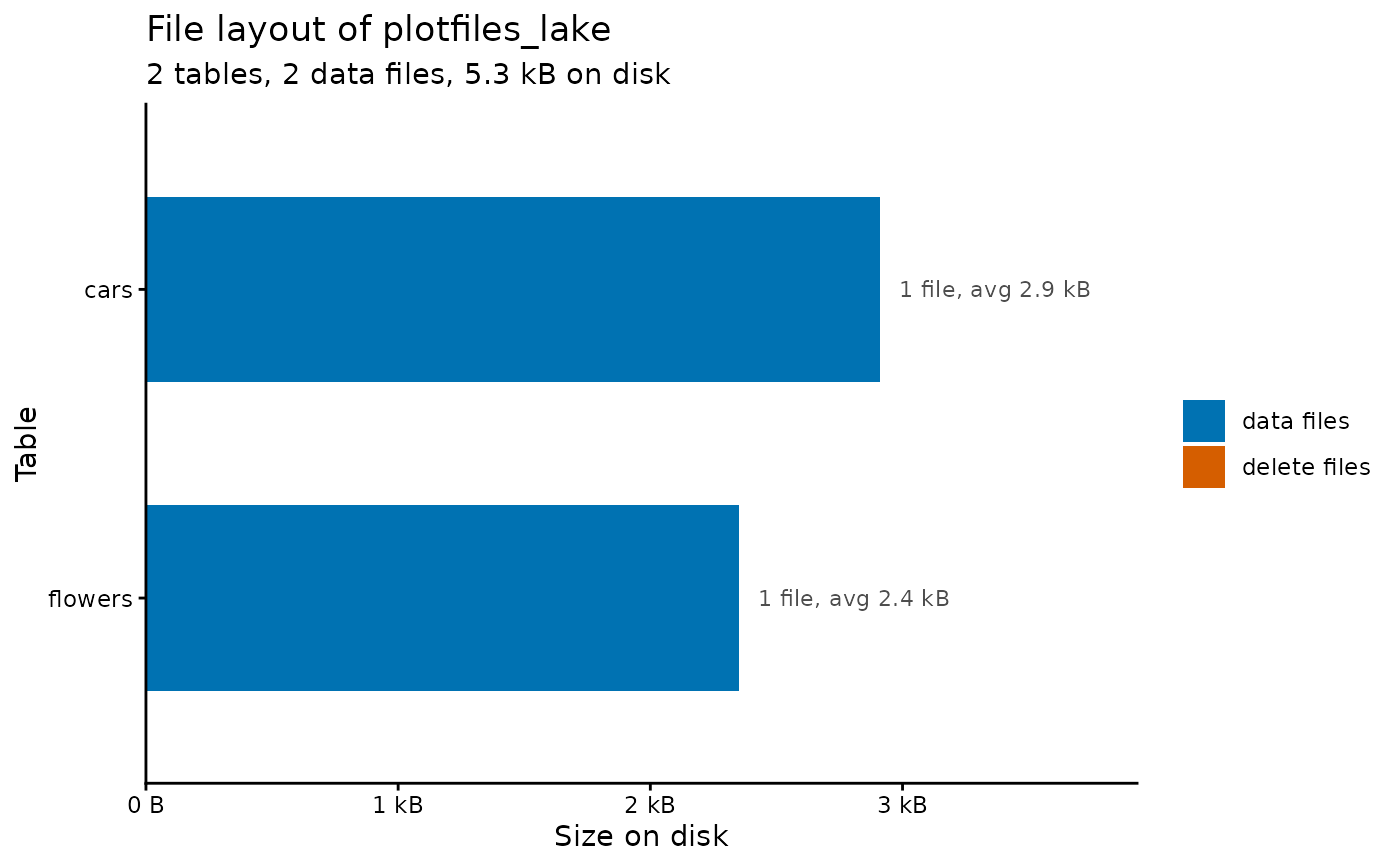
plot_table_files() +
ggplot2::theme_classic()
# Customize the result like any ggplot
plot_table_files() +
ggplot2::theme_classic()
 detach_ducklake("plotfiles_lake", shutdown = TRUE)
unlink(lake_dir, recursive = TRUE)
detach_ducklake("plotfiles_lake", shutdown = TRUE)
unlink(lake_dir, recursive = TRUE)